AI visibility
Where you stand
How to read the AI visibility scorecard, from the share of questions you appear in to average tone and position, and what changes once two weeks of readings exist.
Where you stand is the scorecard at the top of the AI visibility Overview. It condenses every answer on your panel into a handful of numbers, and each one carries a note about what it can honestly claim.
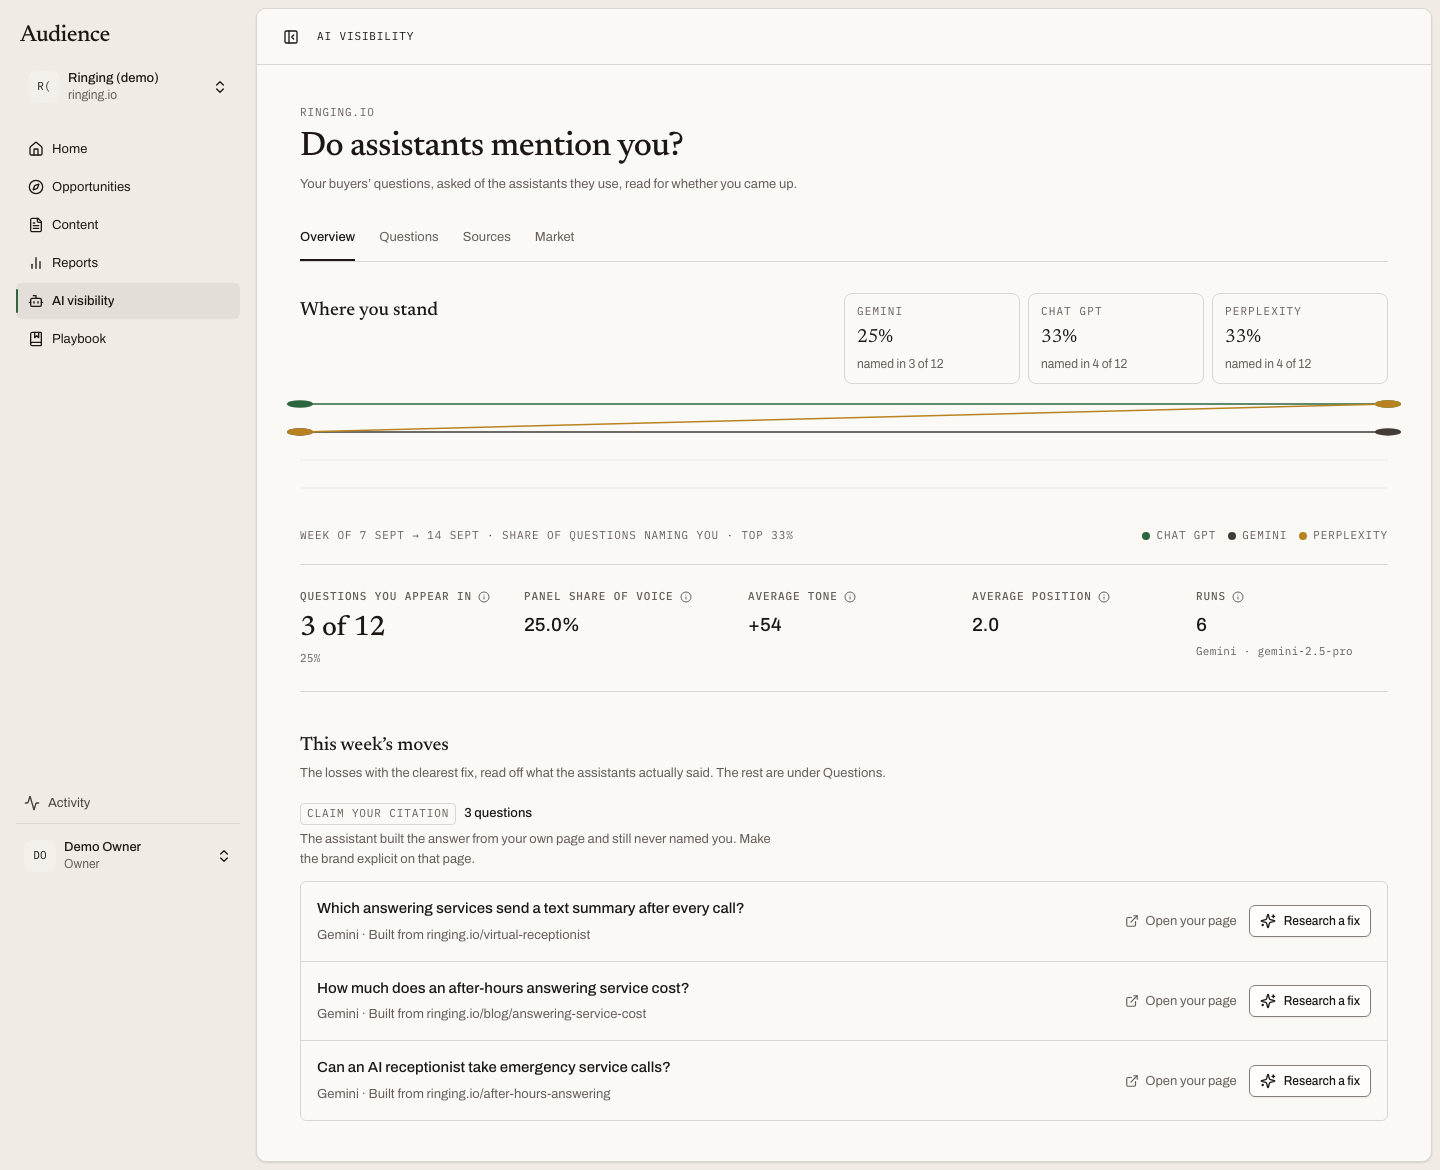 Each assistant gets its own tile, so a bad week on one does not hide inside an average.
The numbers
| Metric | What it says |
|---|---|
| Questions you appear in | "1 of 50", with the percentage underneath. How many of your panel's questions the latest answers named you in. |
| Panel share of voice | Across all the answers to your questions, the share of mentions that were you rather than the other companies named. Counted only across your own questions, so a brand outside your category cannot crowd the denominator. |
| Average tone | How you were described, from −100 to 100. Blank when the run did not score tone. An unassessed brand is not a neutral one, and Audience never fills the gap with a zero. |
| Average position | Where you sat inside the answers that named you. Not placed when no answer named you. A place in the answer, not a search rank. |
| Runs | How many times the panel has been asked, and by which assistant most recently. Each run is one sample of a system that does not repeat itself exactly, not a census. |
One tile per assistant
Above the row of numbers, each assistant Scout asked has its own tile: the share of questions it named you in, and how many. For Resemble AI (demo) that might read Perplexity 2%, Gemini 6%, ChatGPT 10%, and it is normal for them to disagree. The assistants read different pages and reason differently, and the tiles are there so you can see which one is the problem.
A tile lets you ask one assistant again without re-running the others, when one reading looks like an outlier and you want a second sample before you act. It is a spend, so it is a button.
If an assistant refused a run, its tile keeps the last good reading and says the latest attempt failed, rather than showing zero.
The trend
Under the scorecard sits a line. For the first fortnight it is a per-run sparkline: every run is a point, and the caption says how many runs there have been and how far the share has moved since the first. Once two distinct weeks of readings exist, the line becomes a weekly trend, pooling each week's answers per assistant so a single odd morning cannot swing it.
Read the trend, not the latest point. That is the whole reason the panel runs every morning rather than once a week: a single reading carries real variance, and four readings a month cannot separate a genuine change in visibility from the model phrasing itself differently.
What to do with it
The scorecard tells you how you are doing. The section beneath it, This week's moves, tells you what to do. For the full list of questions, who was named instead of you, and what the answers were built from, use the Questions, Sources and Market tabs.