Reports
Reports overview
How the Reports page answers whether Audience is improving growth, what it shows before anything Scout wrote has gone live, and how to read the insights it raises.
Reports has three tabs, and each is phrased as the question it answers: Is Audience improving growth?, Which pages worked? and Is the operation getting more efficient? The tab and the time window both live in the address, so a report you are looking at is a link you can send to someone else.
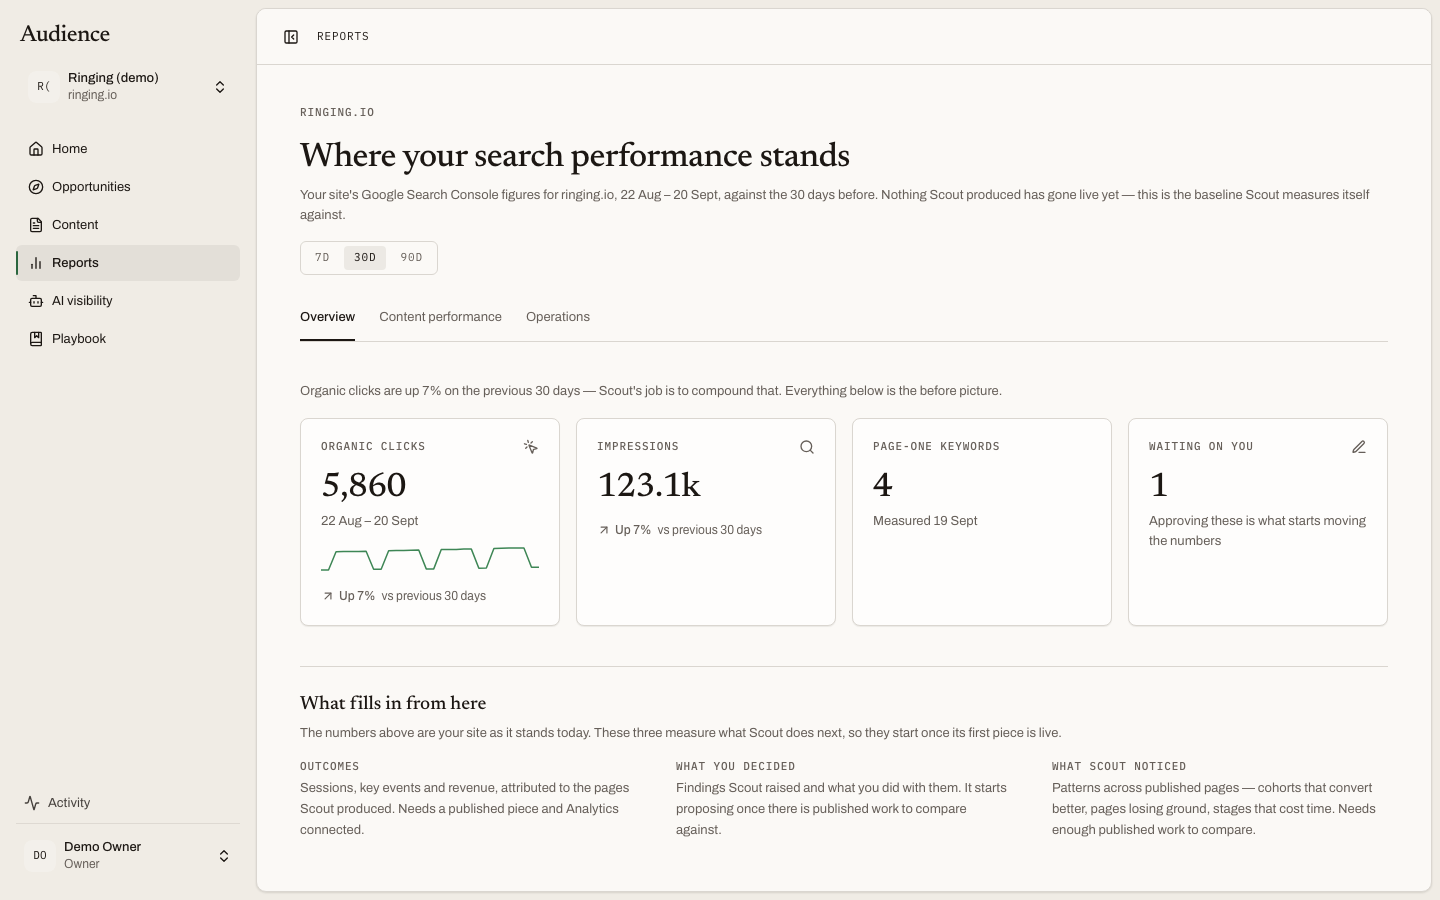 Every number is measured against the period before it.
The window
The switcher at the top sets how many days the report covers. Whatever you pick, the comparison is the same length of time immediately before it, and the page says so: "measured against the {n} days before". A 30-day report compares against the 30 days before that.
Before anything has gone live
Until an article Scout produced has been published, the Overview tab is in baseline mode. The headline becomes Where your search performance stands, and the subhead explains that nothing Scout produced has gone live yet and that this is the baseline Scout measures itself against. Changes are shown but rendered neutral, neither green nor red, because they are not yet anything Scout did. A sentence reads the baseline for you, in one of two directions:
- "Organic clicks are down 12% on the previous 30 days, that slide is the problem Scout is set up to reverse."
- "Organic clicks are up 8% on the previous 30 days, Scout's job is to compound that."
Then: "Everything below is the before picture."
The metric cards
- Organic clicks and Impressions from Search Console, each with its change.
- Page-one keywords, with the date it was measured, or "Scout takes the first ranking snapshot during setup." before it has.
- Published, the pieces that went live in the window. In baseline mode this card is Waiting on you instead, the outlines and drafts awaiting a decision, with the note that approving them is what starts moving the numbers.
Outcomes
Clicks are the means; outcomes are the end. With Google Analytics connected, this section shows Sessions, Key events (the conversions your Analytics property counts) and Influenced revenue from the pages Scout can attribute. Where Analytics records no revenue metric, the card says "No revenue metric configured" rather than showing a zero.
Without Analytics the section reads Outcomes are not measured yet. and explains what connecting it would add. See connect Google Analytics.
What you decided
A small tally: insights accepted, and insights awaiting a decision.
What fills in from here
In baseline mode, Outcomes and What you decided are replaced by three short definitions, Outcomes, What you decided and What Scout noticed, each naming the thing that turns it on. Read it as the map of what the page becomes.
What Scout has noticed
Insights are findings Scout drew from your own numbers. Each shows its type, the date, a confidence, a title and a description, and its evidence figures inline rather than behind a click. Under each is a Do next recommendation, the content it covers, and two buttons: Accept and Dismiss. Accepting an insight changes what Scout plans next; dismissing one tells it the pattern does not matter here.
Before there is enough published work to compare, the list says so: "No findings yet. Scout looks for patterns across published work once there is enough of it to compare."
Owners and admins accept and dismiss insights. See who does what.
The summary card
When a narrative summary is available, a card at the top of the tab gives the headline, a short summary and a few sections written from the same numbers. It is regenerated on a regular cadence rather than on every visit.
Nothing to report yet
Reports read Search Console data. Without it, the page says Nothing to report yet. and explains that it fills in on its own once Search Console is connected and the first sync lands. See connect Search Console.
The other tabs
Content performance answers which pages worked. Operations answers whether the operation is getting more efficient.